This page contains information on how to use this application.
The left hand-side contains a list view of all graphs with filtering and sorting options as well as an aggregation graph showing the combined energy outcome.
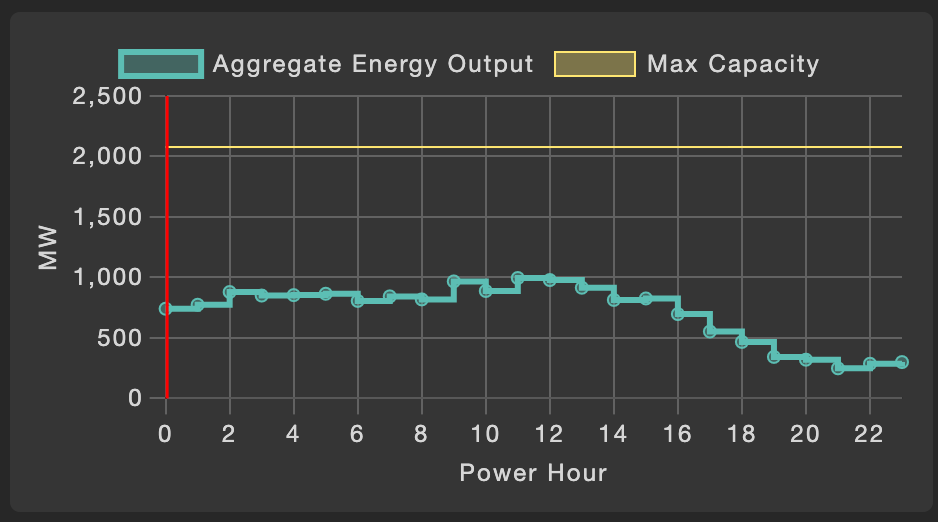
You can find a graph displaying the energy production of all farms combined per pour hour. In addition to this, you can also see the aggregated maximum capacity of production. You can select the different features you want to hide from the graph by clicking on their names. lastly, this graph gets updated based on the filters that are applied on price area.
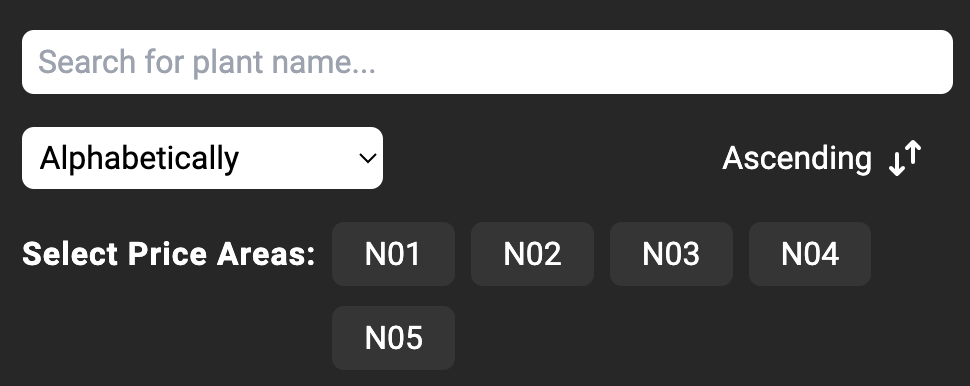
The search bar can be used to find a specific plant based on it’s name. Additionally, multiple sorting options can be found with the option to sort them in Ascending or Descending order. The user is also able to filter the list of farms based on the price area to which they belong. This hides the markers in the map that do not belong to this price area.
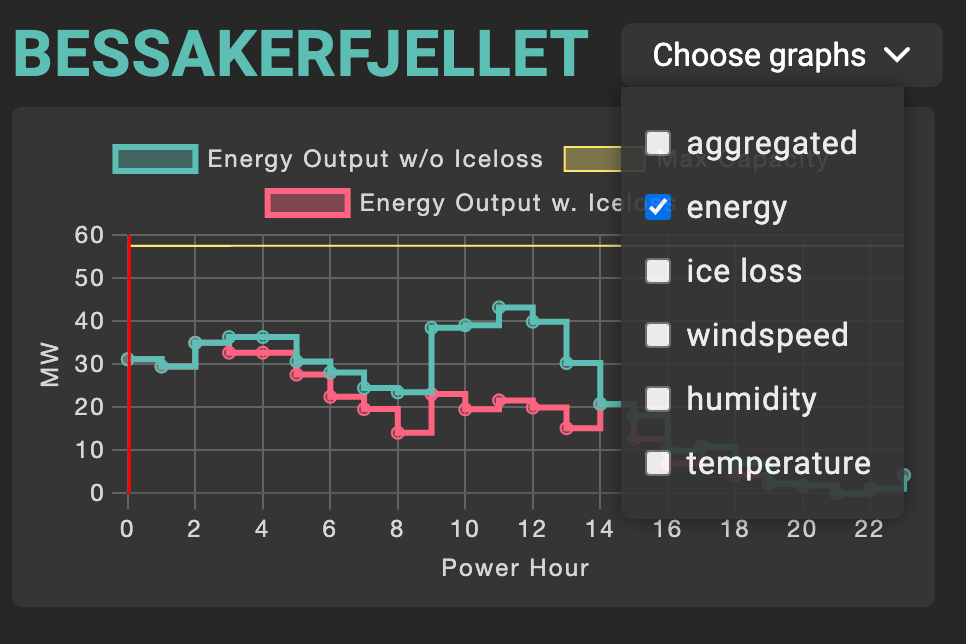
Once a plant is slected more information about the plant appears. A selection button “Chose Graphs” can be found at the top right. This anables the user to select which graphs to show. The options include the following graphs: aggregated energy production, energy production for specific plant, wind speed, humidity, temperature, and the percentage of energy loss due to icing.
On the right you can see the map of Norway which has by default some pre-defined parameters displayed on it. In order to change these, you must look into:
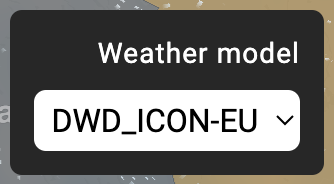
The weather model that is used to generate the predictions of energy production can be selected with the “Weather model” dropdown list. It’s use is for demonstration purposes. The logic for this is not implement.
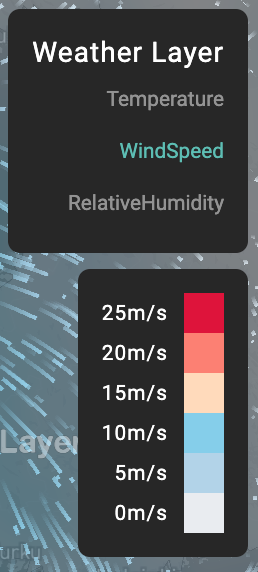
The Selection box “Weather Layer” allows to select which weather characteristics to display in the map. If the name has a turquoise color, it means that that characteristic is chosen and you can see it’s effect on the map. You can choose to not display any weather layer by deselecting the one that is currently selecting. The legend of colors underneath it relates to the weather characteristics.
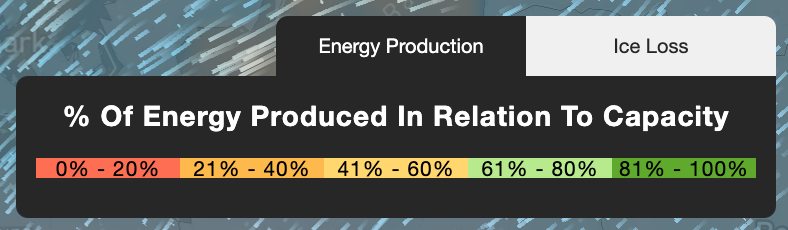
The color of the markers is defined by the % of energy they produce at a given time, or by % of energy loss due to icing events. In order to choose which event you want to visualize you can switch between “Energy Production” and “Ice Loss”.
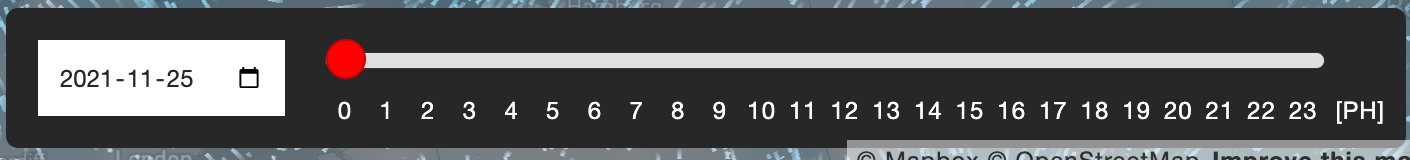
To change the date for which you are interested in visualizing the production of energy and weather conditions you can click on the calendar icon and a pop up window will allow you to change the day, month and year. To change the time you can either drag the red buttom or click on the specific power hour that you would like to choose.
To change the date for which you are interested in visualizing data you can click on the calendar icon and a pop up window will allow you to change the day, month and year. During 2021 the energy data and iceloss data is available, the weather data is only available for 25.11.2021, which is the default day.


One way to find a specific power plant is by typing it’s name into the search bar.
You can filter the displayed data based energy price areas. The selected area is highlighted by a turquoise color.

This project was built using React and Next.js and utilizes JavaScript as front-end. The weather animations are built on top of MapBox and WeatherLayers, whereas the seen graphs are built with chart.js. Deployment of this project was achieved with Vercel.

IVIS 2024